Task and data
The data featured in this article come from a set of 953,000 rRNA fragments sequenced from stool samples submitted by participants in the AGP25, powered by TMI (https://microsetta.ucsd.edu/). The fragments are 150 nucleotides long and come from the V4 region of the 16S rRNA gene.
In the BLS mini game (Fig. 1a), the player sees 7–20 sequences of 4–10 nucleotides. Each sequence is displayed as a vertical pile of bricks, each color representing a nucleotide (through a random mapping between colors and nucleotides). The bricks are collapsed (all gaps are removed), and the player is asked to insert a finite number of gaps to improve a score determined by the number of bricks correctly aligned to the guides. These targets, located on the left, display the most common nucleotides in the corresponding alignment column. By inserting gap tokens, the player is using their natural knack for pattern matching to realign a region of the scaffold alignment. The limited number of tokens, set by a naive greedy artificial intelligence (AI) player based on how easily it could improve the alignment, forces the player to make tough choices. This greedy player also sets a target score that the player must beat to progress to the next puzzle, enforcing a minimal effort.
During the first year of the initiative, we collected approximately 75 million puzzle solutions (mean, 43 per puzzle). The solutions were used as ‘votes’ by players on potential errors in the scaffold alignment, and a corrected alignment was generated. Here we report results for our BLS alignment and benchmark alignments produced by several state-of-the-art de novo multiple alignment programs (PASTA, MUSCLE and MAFFT) as well as an alignment produced by a greedy algorithm (Methods and Supplementary Information, sections 12–15).
Complex citizen science tasks can be embedded in video games
Integrating a scientific task in a commercial video game from a franchise that sells millions of copies constitutes a risk. The scientific mini game must not look out of place in the broader game as it could break immersion, an important component of role-playing games. This is especially true when integrating a puzzle game into a shooter–looter role-playing game such as Borderlands 3, in which the player expects to face fast-paced action and humor. BLS was specifically designed to address this potential issue by integrating dialogues with characters from the Borderlands universe. The virtual arcade booth was located in a virtual laboratory within the game universe and is presented as belonging to the resident scientist. The gameplay was simplified to make sure that the pace matched a shooter–looter game, and all the visuals were specifically designed to make sense in-universe.
As of May 2023, 3 years after launch, 4.45 million players had visited the arcade booth. Of these players, over 4 million completed the 10-min tutorial and at least one real task. This represents an engagement rate of 90%, which is a substantial improvement over Phylo, the previous sequence alignment CSG, which has reported an engagement rate of around 10%. This level of player engagement demonstrates that the ultra-gamification of the task worked and that its integration into the commercial game was seamless.
BLS outputs a high-quality MSA
The evaluation of the BLS alignment output is complicated by the absence of a universal ground truth to benchmark against. Nevertheless, there are several qualities typically expected from a high-quality alignment that we can investigate. Indeed, a high-quality alignment of homologous genomic sequences tends to:
-
a.
Have a high sum-of-pairs score
-
b.
Have a gap frequency compatible with that RNA family’s indel frequency
-
c.
Allow the inference of phylogenetic trees that resemble the state of the art for that family
-
d.
Appropriately separate taxa associated with different illnesses, behaviors and profiles in the host
-
e.
Be compatible with the structural signature of the family
We assert that the BLS alignment satisfies all these criteria and, thus, constitutes a high-quality MSA.
In Table 1 (top), we show that BLS improves the sum-of-pairs score compared to all benchmarks when excluding heavily gapped columns from the scoring, thus satisfying a.
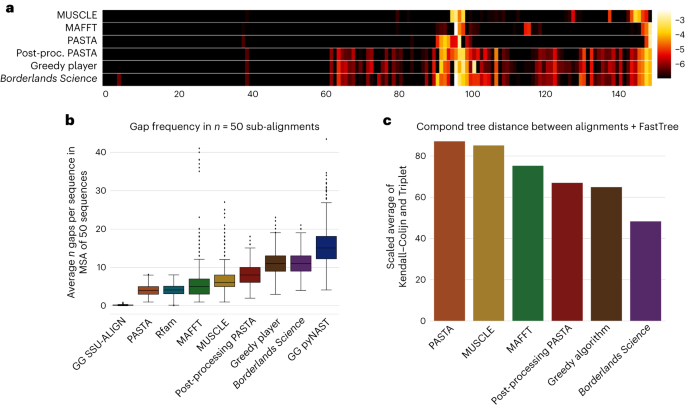
In Fig. 2b, we show the gap frequency sampled from sub-alignments (we sample sub-alignments to account for differences in number of sequences among Greengenes, Rfam and BLS) for BLS and benchmarks. These benchmarks include PASTA27, MUSCLE28 and MAFFT29, the pyNAST30 and SSU-ALIGN31 alignments from the Greengenes32 database and the structural Rfam33 alignment. We observed that all alignments had a gap frequency in the same order of magnitude as PASTA, Rfam and pyNAST. This low gap frequency is consistent with the strongly structured nature of the V4 region, which varies in length by only a few base pairs between microbes. Thus, the BLS alignment shows a gap frequency that is compatible with our state-of-the-art knowledge of the V4 region, and criterion b is satisfied.

a, Here the gap density by column is shown for six different alignment methods. The x axis corresponds to the alignment position, and the color corresponds to the log gap frequency at this position. Highly gapped columns were excluded so all alignments could be of the same length. b, Gap frequencies observed in BLS and other methods, averaged from sampled sub-alignments of 50 sequences. The box plot shows an overview of the distribution. The three horizontal lines in the box, from top to bottom, show, respectively, the boundaries for the upper quartile, the middle quartile and the lower quartile. The total height of the box represents the interquartile range (IQR). The whiskers are located 1.5 times the IQR from the ends of the box. The dots outside the whiskers are the outliers. Note: one outlier point for the right-most distribution, pyNAST, with a value of 124, is not shown on the plot but is considered in the statistics shown. c, Compound distance to the reference Greengenes tree. That compound metric was obtained as a scaled average of the Kendall–Colijn and Triplet distance. More detail is provided in Supplementary Information, sections 12a,b and 13c. GG, Greengenes.
Our results in Table 1 and Fig. 2 indicate that the additional gaps inserted by BLS compared to PASTA, MAFFT, MUSCLE and the greedy algorithm led to a improvement of the tree structure.
We present our investigation of criteria c, d and e in the following subsections.
The BLS alignment improves de novo phylogeny
A central objective of improving alignments of microbial genomic sequences was to better understand their phylogeny. To assess whether this goal was achieved, we inferred phylogenetic trees from our alignments with FastTree34 and then assessed their similarity to a reference tree built by placing our sequences into the Greengenes 13.5 (ref. 32) phylogeny with SEPP35. Greengenes has been previously benchmarked for fragment insertion, and SEPP with Greengenes has been shown to outperform de novo phylogeny inference, when a high-quality tree and alignment are already available36.
Our phylogenetic similarity results, shown in Table 1 for two distance metrics, Kendall–Colijn37 and Triplet38 distance, indicate that the BLS phylogenies are closer to the reference than standard MSA approaches. This result shows that the BLS alignment outperforms alternatives for the task of inferring a reliable phylogeny, thus satisfying criterion c.
The BLS phylogeny leads to improved UniFrac effect sizes
We also formulated the hypothesis that improved alignments (and, by extension, de novo phylogenies) would lead to some improvement in the separation of taxa associated with different behaviors, profiles and diseases. To confirm this, we measured effect sizes on UniFrac26 distances over 74 non-technical variables available in the AGP metadata associated with the samples used for sequencing. These variables relate to the host’s lifestyle, health condition, food or general profile.
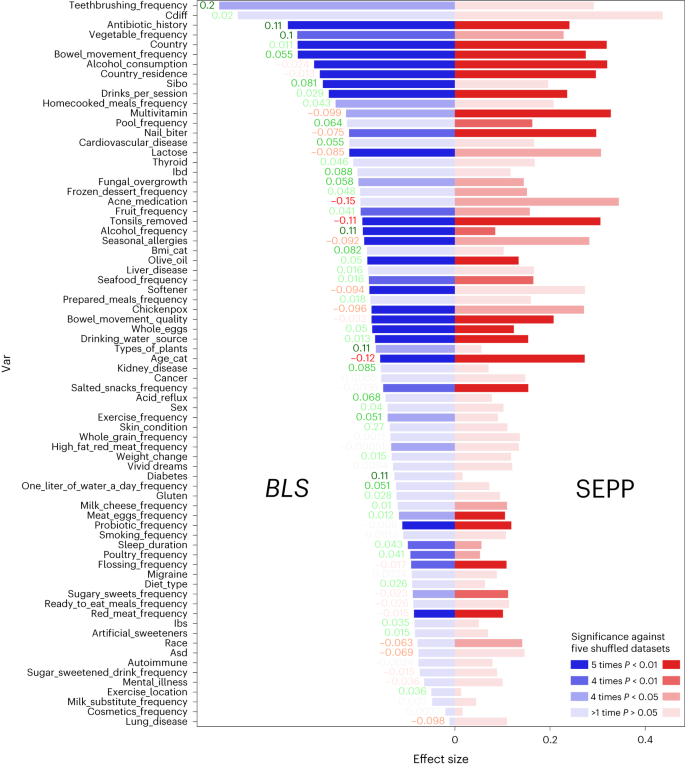
The strongest effect sizes that we observed were for teeth brushing frequency and prior Clostridium difficile infection (full list in Fig. 3 and Supplementary Information, section 14). We report the average pairwise effect sizes between BLS and Greengenes + SEPP in Fig. 3. We observed that BLS outperforms SEPP on many variables, including several that have been linked to gut microbe diversity and human health25,39,40,41,42. The top five variables with highest delta are, respectively, teeth brushing frequency, diabetes, number of types of plants, antibiotic history and alcohol frequency.

Delta means pairwise effect sizes between BLS and SEPP for each variable. Significance, indicated with the transparency, refers to the P value obtained from a two-tailed Mann–Whitney U-test against shuffled metadata. More detail is provided in Supplementary Information, section 14.
We backed up this analysis by assessing whether the effect sizes obtained were significantly different than what could be observed in a random assignment of categories to samples. We annotated Fig. 3 with the P values associated with the null hypothesis that our results are compatible with a random outcome. We observed an enrichment of significant outcomes in the variables with high effect sizes and, in particular, 13 variables for which BLS achieves a higher significance category than SEPP, whereas the opposite occurs 10 times, generally on variables with lower effect sizes.
These improvements observed on most variables confirm that the previously reported improvements to phylogeny can be perceived in meta-analyses. Although overall improvement over SEPP is limited as SEPP still outperforms BLS on important variables, such as age category, BLS does outperform SEPP, and the two approaches lead to distinct solutions that are complementary in improving understanding of gut microbe phylogeny and its impact on human health, thus satisfying criterion d.
The BLS alignment improves support for 16S rRNA structure
As stated previously, the structure is an important component of a high-quality MSA of a strongly structured RNA region. Given that the BLS alignment contains about 99% of bacterial sequences, it is possible to map its columns to the bases of the state-of-the-art structural model of the 16S bacterial rRNA defined on the Comparative RNA Web43.
To estimate the quality of such mapping, we report the proportion of non-gap nucleotides that cannot be mapped to the structure (see Table 1, bottom). It turns out that alignments such as BLS and PASTA map rather easily, whereas MUSCLE and MAFFT lose substantially more information.
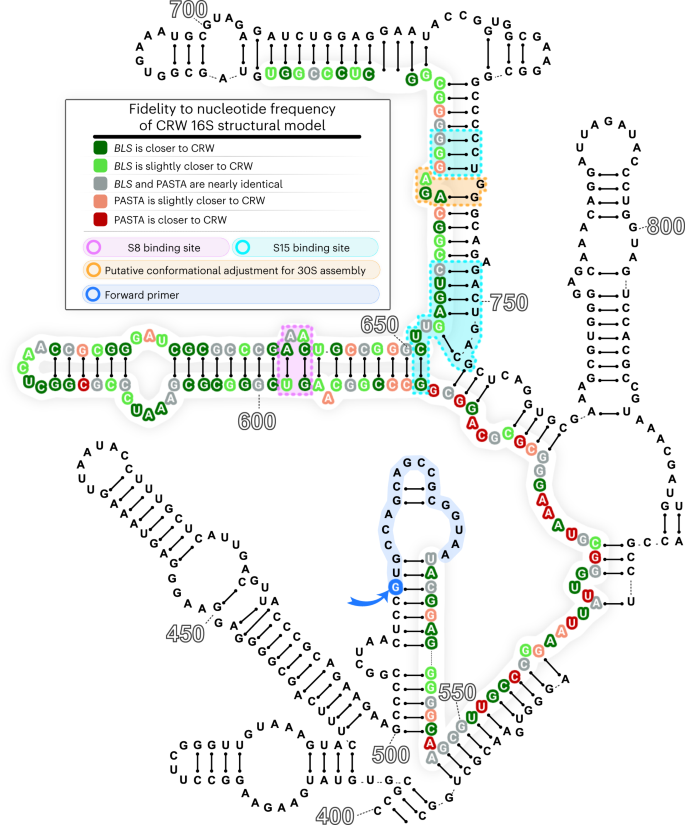
To deepen our evaluation of the structural quality of the two alignments that map well, we investigated column by column whether the differences between BLS and PASTA alignments tend to agree or disagree with the model. In Fig. 4, we show that the changes added by human players tend to agree with the 16S structural model, especially in regions linked to important functional sites, such as S8 and S15 binding sites, and a region that undergoes conformational readjustment during 30S assembly44,45,46,47,48,49. This agreement is a strong argument in favor of the BLS alignment as the CRW model considers long-range base pairs, a context that is not available to the players solving small puzzles. This is important because, as shown in Fig. 2a, the region of the alignment with the most gaps and the most variation between methods is the top of the V4 stem, a region with considerable mapping improvements for BLS in this analysis.

After mapping the BLS and PASTA alignments to the 16S structural model, we observed a higher conservation for BLS, especially near important functional sites. The figure shows an annotated 16S secondary structure where only the V4 region and its vicinity are shown. Colored bases form a continuous backbone. CRW, Comparative RNA Web.
This demonstrates that the modifications to the PASTA scaffold added by BLS led to an improvement of the structural and functional signal of the alignment, thus satisfying criterion e.
Additionally, in Fig. 2a, we show the gap frequency per column (excluding highly gapped columns) of different alignment methods, including BLS and our benchmarks PASTA27, MUSCLE28 and MAFFT29. These gap frequencies help reveal the differences between BLS alignments and alternatives, on top of satisfying criteria a–e.


